A. Flexibility options of the EU-member-states
In December 2013, EU-Parliament and Council could reach an agreement on the main issues of the CAP-Reform 2013. The final EU-Regulation 1307/2013 is already published in the Official Journal of the European Union. Some of the main issues of the reform allow a lot of flexibility for the single EU-member-states. The following article will go into details which of the options are going to be used by the EU-member-states.

Extensive grassland in rural Bulgaria
Flexibility of EU policies in general might even be useful if motivated by the concept of subsidiarity, which means that specific political problem is decided by the decision level (regional, national or EU), which is capable and in the position to do the most appropriate and precise decision and to design an efficient policy-solution. That is so far the theory.
The decision upon the CAP-reform 2013 was taken in a quite complicated institutional environment, where EU-Commission, EU-Parliament and EU-Council had to agree to the reform. Besides those three institutions, specific national interests of 28 EU-members and also party-loyalties had an influence on the decision-process. So the flexibility elements of the CAP-reform have not always been introduced because of subsidiarity, but rather, because otherwise, some of the issues within the reform would not have been solved at all. This fact has already been criticized by scientists (Lakner et al. 2013), however, the interesting question is now, how do the EU-member-states use their flexibility options and do the flexibility elements at the end improve the reform.
We will focus on the following flexibility elements of the CAP-reform 2013, note that there are still some other flexibility elements (see Menadue and Hart 2014):
1.) Redistribution of direct-payments:
- Degressivity tax of direct payments: According art. 11 in the EU-regulation 1307/2014, member-states have to reduce direct-payments exceeding 150.000 EUR/beneficiary by a so-called degressivity-tax of min. 5%. That also means, that member-states can increase the degressivity-tax up to a 100% tax, which is finally the concept of capping of direct-payment. Member-states can optional subtract salaries paid on farms from the direct-payment and thereby reduce the tax-load for large and labour-intensive farms (art. 11, 2).
- A more relevant option might be the use of a redistributive payment, which is a top-up payment for the first hectares of a farm, instead of the degressivity tax (art. 11, 3). So 5% of the national ceiling can be used to pay a top-up for the first hectares up to the limit of 30 hectares or up to the average size of agricultural holdings (art. 41, 2). E.g. in Germany, a top-up-payment for the first 46 hectares is paid, which is the average farm-size in Germany.
The topic of the redistribution of direct-payment has raised many debates in the last reforms 2005, 2009 and 2013. Especially the option of a redistributive payment has been criticized in Germany by Bahlman and Sahrbacher (2014) as ‘museum-premia’, since it potentially supports small structures in agriculture, but does not substantially contribute to support small farmers e.g. on the land markets. Besides this, the redistribution of direct-payment is about fairness of distribution, which is a political term, but hard to scientifically evaluate. Therefore, ag-economists for many goods reasons are generally very reluctant in giving positive statements on this option. The overall consensus seems to be, that the state should not intervene into agricultural structures. However, it will be interesting to see, what options the member-states use.
2.) Flexibility between pillars: Member-states can reallocate funds between the two pillars (art. 14). For this option, member-states have to declare their willingness to do so to the EU-commission by the end of 2013 for using this option in the year 2014, and by August 1, 2014 for the years 2015-2020. The rural development programs (Pilllar 2) can be regarded as potentially more targeted. In practise, a lot of the P2 programs are still suffering from unfocused and poor policy design and from windfall gains (as e.g. in the agri-investment-schemes) (see Zahrnt 2009). However, the principle of policy design in P2 is a definition of objectives, design of appropriate measures and a minimum-standard of evaluation – even though there is a lot of scope for improvement here. Therefore, a strong shift to P2 could support a more targeted and efficient use of tax-payers money for policies, which are designed and co-financed on the national or regional level. Therefore, some experts say, that this might improve the overall balance of this reform. On the other hand, the CAP-reform 2013 also has the option for member-states to reallocate funds from P2 into P1 (direct payments), which might be used to increase the level of direct-payments in some of the member-states (with a low level of direct payments).
3.) Re-coupling of direct-payments: Member-states can use coupled payments for particular sectors or farm-types facing specific challenges (Fig. 49) and which deserve (from the perspective of a member-state) support for environmental or social reason. First of all, the formulation in the EU-regulation is very broad and unspecific and it leaves a lot of space for interpretation. But basically, the member-states have to bring some arguments to the EU-commission, why a specific sector or farm-type needs specific support by coupled direct-payments. Member-states can use between 8% and 13% of their national ceiling for coupled support and another 2% of the ceiling to support protein-crops. Since coupled direct payment are generally regarded as more distortive to production and trade, an excessive use of this element (if not for environmental reason, so e.g. an extensive grazing premium) might bee seen critical. It is therefore also very interesting to see, how many member-states are still using this tool.
B. Status of Implementation in the Member States
The EU-member-states have to report the options they want to take until August 1, 2014. Nonetheless, some of the member-states have already taken a decision. Therefore, I did a detailed web-search on available government-documents, I reviewed the available issues of Agra Europe. I also did a written request some of the CAP-experts I know and to the ministries, where I could not find any information. The objective of this exercise is to get a picture as complete as possible on what is the actual status implementation in the member-states. I also asked, if there is already a tendency within in the ministry, what option the member-state wants to take. There is also a similar overview recently published by Henrietta Menadue and Kaley Hart from the Institute for European Environmental Policy (IEEP), which has though a slightly different focus.
Note that in Belgium, the region of Flanders and Wallonia and within the United Kingdom, England, Scotland, Wales and Northern Ireland are using different options. This is the reason why we have to evaluate not 28 EU-member-states but rather, 26 EU-member-states and another 6 regions within Belgium and UK. Actually, we could get information from almost 22 of 32 EU-member-states / regions and these are the main tendencies. If we indicate an intention in the following graphs, that means that the ministry has not yet decided and the intention is just a tendency, which is still subject of the political debate and the decision process in the member-state.
1.) Redistribution of direct-payments:
For the redistribution options, we could get information from 16 member states / regions. The following fig.1 shows the decided or intended options by the member-states:

Fig.1: CAP-reform 2013 – redistribution (n=18, updated)
It is already quite clear, that most of the countries are opting for the simple degressivity tax, just four countries (Germany, France, Wallonia and Bulgaria) will work with a redistributive payment and Romania is tending to opt for a redistributive payment. The majority tend to use the degressivity tax. Ireland and Northern Ireland will apply a 100% degressivity tax, which is finally capping direct payment at 150.000 EUR. Still for 16 member-states there is no information.
2.) Re-coupling of direct-payments:
For recoupling of direct payment we could get information from 21 member-states /regions. The main policy options are described in the following fig.2:

Fig 2: Coupling of Direct-Payments (n=21)
Most countries are tending to use the instrument of coupled payment and in most of the 13 countries, the full envelope of 13% will be used, some of the countries will use the 2% for protein crops, but not all of them. The countries which are opting against coupled payments are Germany, Irland, Austria (sic!), Wales and England. Italy and Estonia are also sceptical to coupled payments, but in both countries the final decision is not clear yet.
3.) Flexibility between pillars:
We could get information on the decisions and tendencies in 22 member states /regions, which is documented in fig. 3:

Fig. 3: CAP-reform 2013 – Allocation Pillars (n=22, updated)
The figure indicates, that both directions of transfer is used. Still the transfer to pillar 1 is only used in Poland, Croatia and Slovakia. This was especially surprising in Poland, since the former minister for agriculture had a strong emphasis on P2-policies, which is now under different under the minister. Germany, France, UK (England, Wales, Scotland), Flanders and Latvia. In Northeren Ireland, the agricultural minister was in favor of a reallocation to P2, but the cabinet did not support this option. Hungary might also use the option to increase P2-budget. The following fig.4 is showing the relative shift in the different EU-member-states in percent:
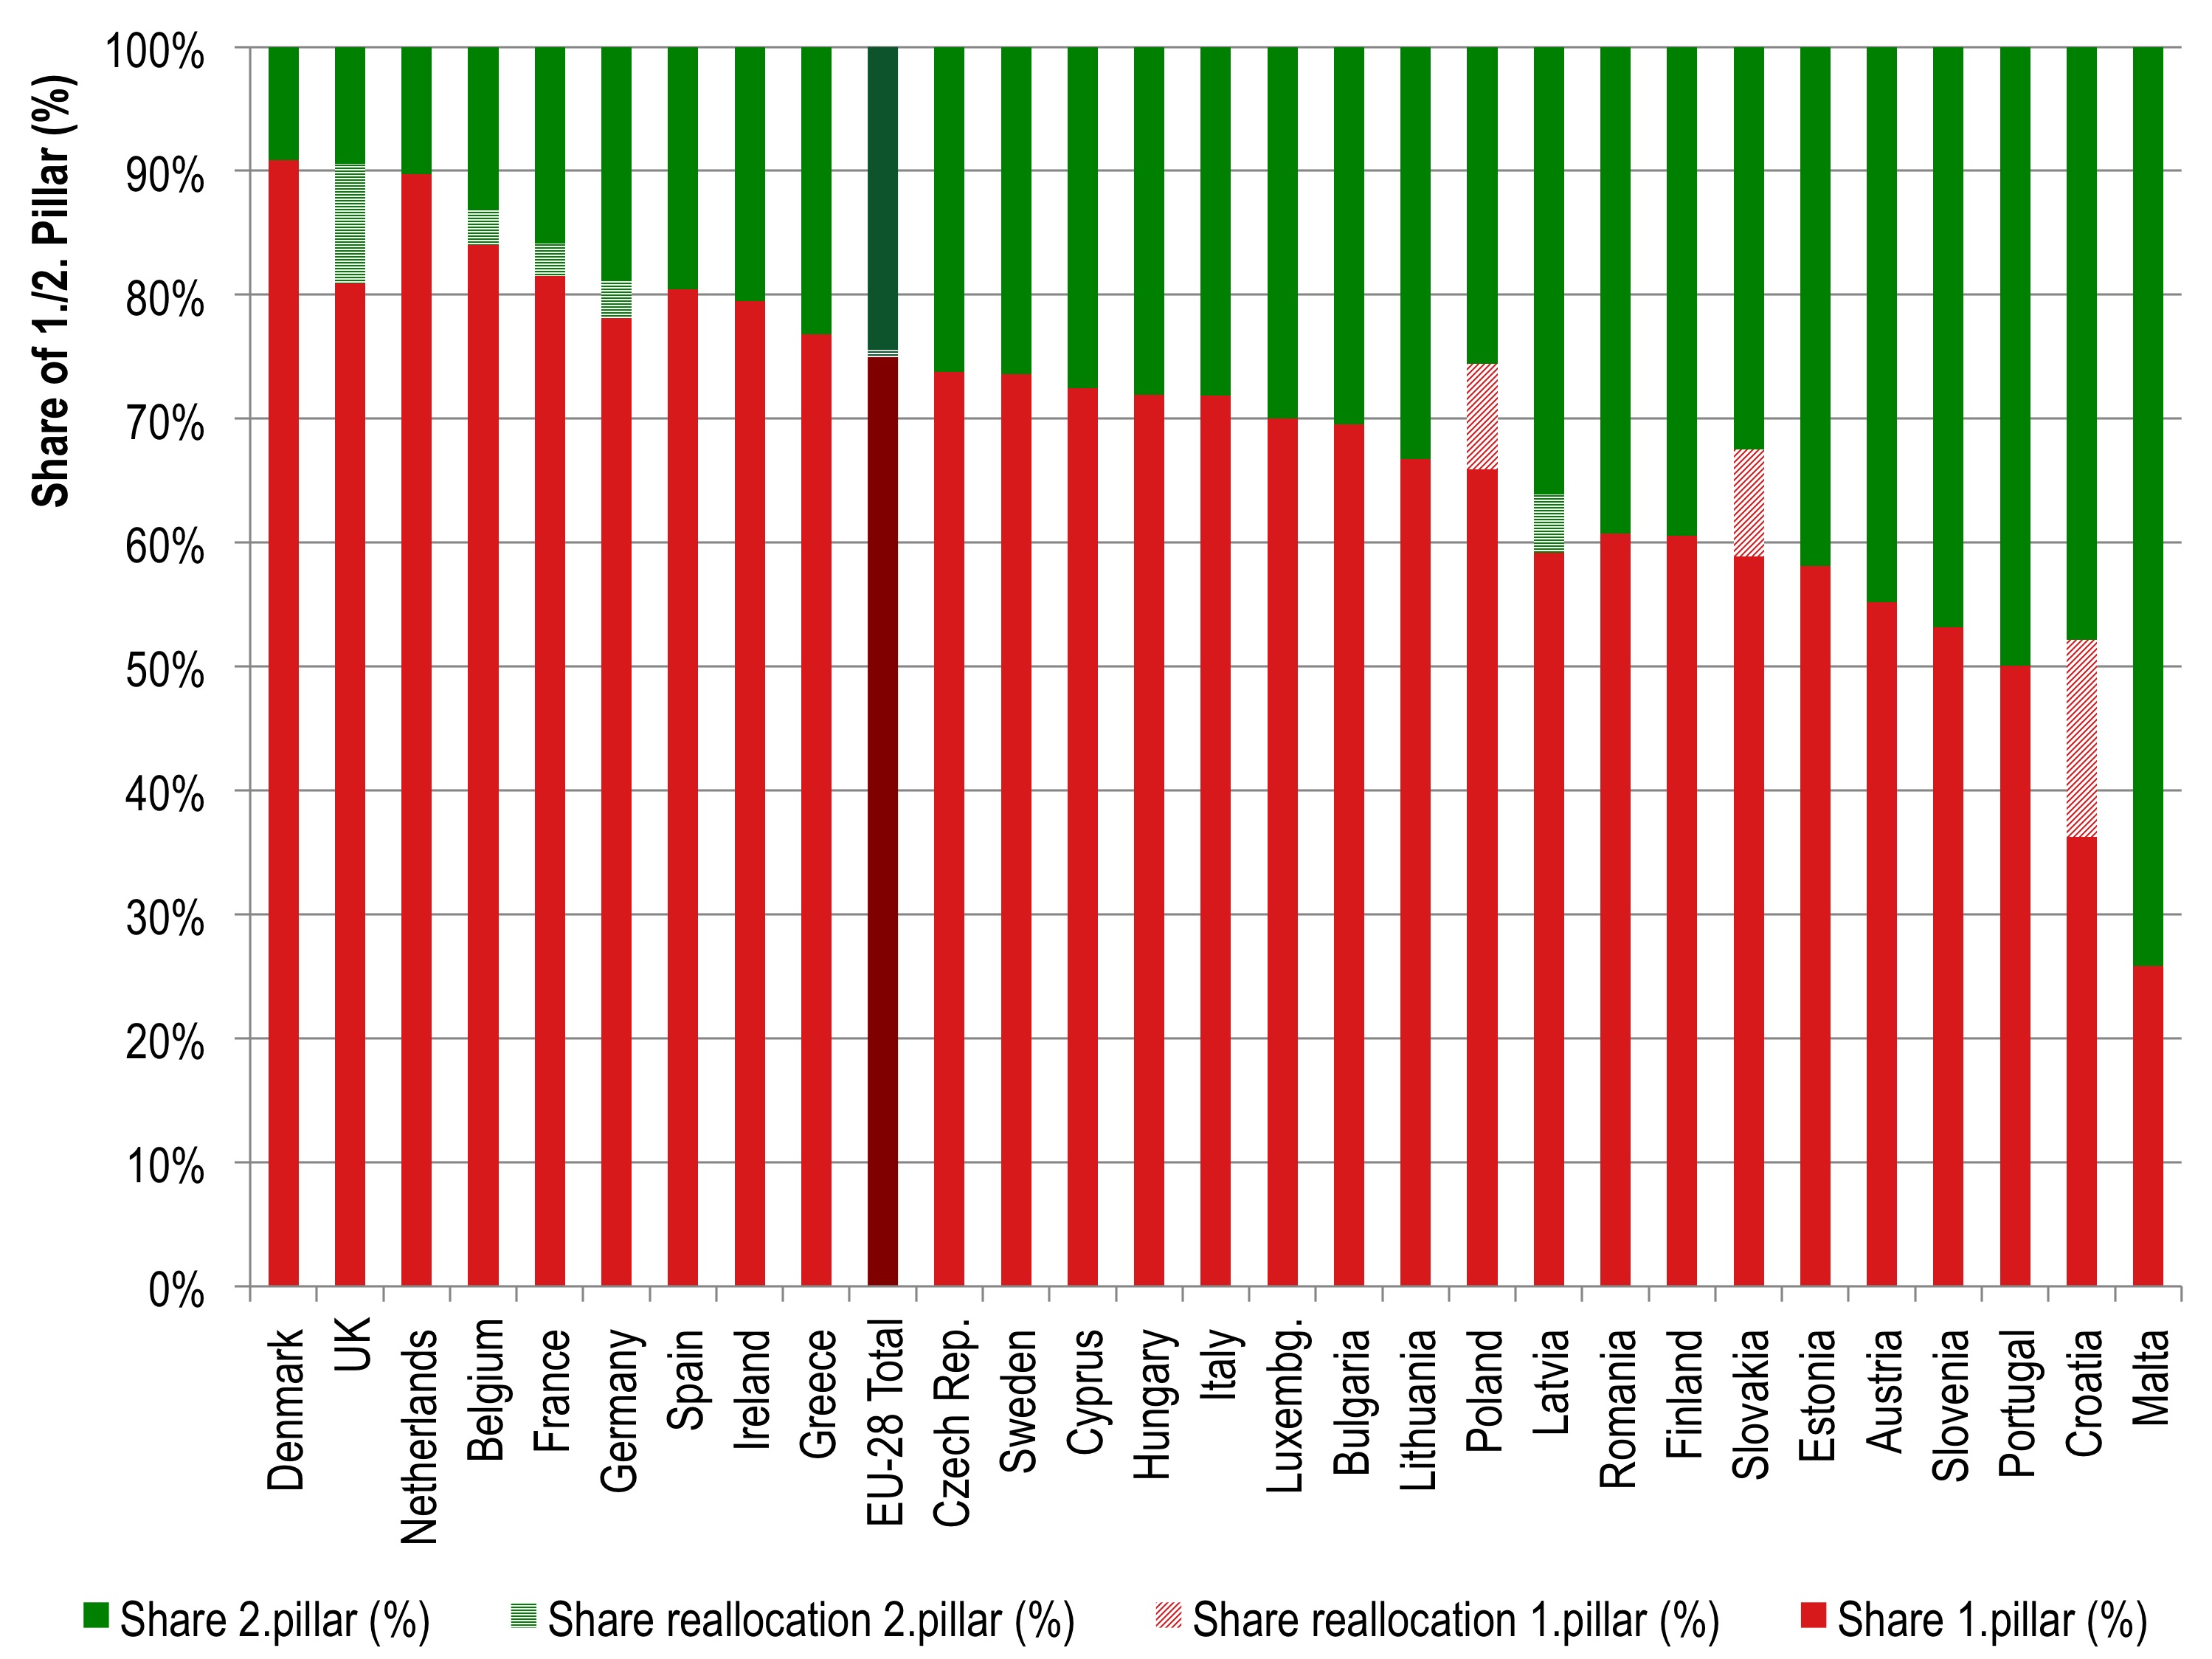
Fig. 4: Reallocation 2014-2020
Since the ‚big‘ EU-members Germany, UK and France are all opting for a reallocation to P2, the net-effect on the total budget of the EU-28 is 0,6% between 2014 and 2020. This might still change a bit, since especially the situation in Italy and Spain is not yet clear, but the most of the large countries have already done a final decision. We can also see, that countries, that are using reallocation in order to increase the level of direct payment, such as Poland, Croatia and Slovakia, have an originally a rather low level of direct payment, on the other hand, countries with a relatively low level of P2-budget, use the option to shift funds to P2. Overall, the 2.46% of the total EU-budget is allocated with the net-tendency (0.6%) towards P2. The following graph shows the net-budget transfer. Nonetheless, this might still change as soon as some of the remaining countries (especially Italy and Spain!) make their final decision.

Fig. 5: Reallocation net effect
Status: 25.04.2014.
Updates: on 29.04.2014, I included some new information from Finland, Sweden and also Romania in the figure 1 and 3.
Thanks: Most of these information were gathered by support of different experts and colleagues of mine. Therefore great thanks to: Alex Lotman (Estonia), Oana Tanasache (Romania), Sebastian Hess (Sweden), Ewa Rabinowicz (Sweden) Anne van Doorn (Netherlands), Marian Stuiver (Netherlands), Sergio Araujo Enciso (Spain), Tomás García Azcárate (Spain) and Thelma Brenes Muñoz (expert for Portugal!). Besides this, I received immediate response and support from the ministries of Poland, Czech Republic, Greece, Finland and Hungary, thanks a lot for supporting this search!
Disclaimer: No guarantee on the provided information, some of these information might not be complete, and a lot of documents are not 100% clear. Especially the information on the intentions or tendencies of the administration might be mistaken (especially when provided in Italian!). So if you have questions, more precise information or even other information, let me know, I am very interested in feedback! This article is subject to constant updates. I hope by next week, I can publish a comprehensive table with the respective information on every country.
Other Sources:
Balmann, Alfons and Christoph Sahrbacher (2014): Mehr als „Museumsprämien“? Zur Förderung der ersten Hektare und Junglandwirte im Rahmen der EU-Agrarpolitik.
IAMO Policy Brief No. 14, Halle (Saale).
Schlagwörter: Agrarpolitik, Agricultural Policy, CAP-Reform 2013, European Union, GAP-Reform 2013, Gemeinsame Agrarpolitik (GAP)

25. April 2014 um 16:47 |
@Sebastian
Thank you for this very useful summary. The Instittute for European Environmental Policy has carried out a similar exercise and you might find some of the information you are missing in their compilation, see http://cap2020.ieep.eu/2014/4/16/member-state-implementation-of-the-cap-for-2015-2020-a-first-round-up-of-what-is-being-discussed?s=1&selected=latest.
LikeLike
25. April 2014 um 18:28 |
Dear Alan, thanks for the comment. In fact I have seen their article last week, so I included the link in my article. In any case, thanks for reminding me!
LikeLike
31. Januar 2015 um 00:27 |
My relatives always say that I am wasting
my time here at net, but I know I am getting knowledge daily by
reading thes nice articles.
LikeLike